- Toprut's New Mexico draw odds are generated from our own computer program using the actual New Mexico applicant dataset for each respective year.
- The true draw odds for a given hunt are better than what you've probably ever read (if you order your choices correctly).
- There are 2 key real world inputs that impact the true draw odds - Group Applications and 1st, 2nd & 3rd choice order.
- Applying as a group in New Mexico will decrease your chances in the draw.
- 47% of individual applicants for elk, deer and antelope were a member of a group application in the 2016 draw.
- New Mexico evaluates your 1st, 2nd and 3rd hunt choices in order to see if a tag is still available before moving on to the next application.
- The optimum application strategy in New Mexico is to put your hardest to draw hunt as your 1st choice, and the easiest to draw as your 3rd choice.
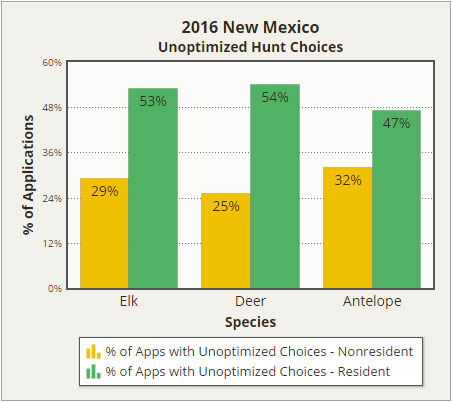
- 48.1% of all elk, deer and antelope applications had incorrectly ordered their hunt choices such that they had a 0% chance of drawing either their 2nd or 3rd choice in the 2016 draw. This is a direct result of those applicants placing an easier to draw hunt in front of a harder to draw hunt.
- Any draw report or simulation available that doesn't correctly account for group applications and actual hunt choice order is missing key variables to calculate odds accurately.
Recently, Toprut obtained New Mexico’s complete application dataset for all big game species going back to 2012. With this real world data at our disposal, we built a computer program that executes the New Mexico big game draw in the exact same manner in which it is described by the state. We’ve ran the draw 100s of thousands of times, with the actual applicant data, and the results have been an eye opener.
Let’s quickly review how New Mexico’s big game draw process works:
- New Mexico does not have a preference/bonus point system – successful applicants are chosen by random chance
- You may apply as group, with a maximum number of 4 hunters per group
- Each individual and group application is assigned a single random number
- Applications are then selected in order, from smallest random number to largest
- Your 1st, 2nd and 3rd hunt choices are all evaluated, in choice order, to see if a tag is available
- If the application is from a group, there must be enough undrawn tags remaining for all members of the group in order to be successful
- Keep in mind that it’s possible to draw your 3rd choice for hunt X, before someone who applied for hunt X as their 1st choice
Our computer draw encapsulates all of these characteristics, as well as some additional logic that handles group applications containing a mix of residents and nonresidents. First, the process constructs the hunt specific tag quotas and the entire application pool for a given year/species from the real applicant data. Then we run each draw thousands of times to normalize individual anomalies and get an accurate overall result. It takes less than 2 seconds to process and store a single draw of 50,000 applications.
In addition to the raw number of applications per a given hunt code, there are 2 key real world inputs that must be considered to calculate the true odds in a previous draw:
1. Group applications
and
2. 1st, 2nd & 3rd choice order
In 2016, 27% of all applications for elk, deer and antelope were group applications. Summing up all the members of these groups tells us that 47% of all individual applicants in the ’16 draw were on a group application. In 2015, the number was slightly higher at 48%. Here is a breakdown of the 2016 numbers by species (Figure 1):
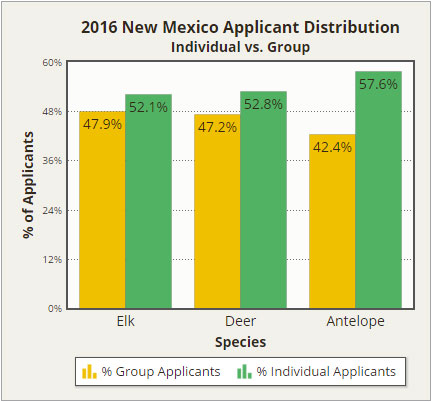
Further analysis of the group applicant data tells us that nonresidents and residents apply as a group at about the same rate for elk. For deer and antelope, nonresidents are slightly less likely to apply as a group than residents.
To better visualize how groups impact the overall applicant pool, let’s look at Unit 16E Elk, 2nd Archery hunt (ELK-2-263) for 2016. Per the published data, there were a total of 410 applicants for this hunt across all three choices. However, when you consider the number of applicants that applied as a group, the total applications for this hunt was only 262.
| Draw Pool | Published Applicants | Actual Distinct Applications | Tags Available |
|---|---|---|---|
| Resident | 245 | 141 | 51 |
| Nonresident | 105 | 85 | 4 |
| Outfitter | 60 | 36 | 6 |
| Totals | 410 | 262 | 61 |
Applying as a group in New Mexico will decrease your chances in the draw. The amount that it decreases your odds is dependent on the total quota for a given hunt code and the number of applicants in your group. In general, the more tags available in your draw pool and the less members in your group, the less it will hurt your chances. Let’s look at some real world examples.
First, we’ll look at a hunt that has a relatively high tag quota. Here are the 1st choice draw odds, by draw pool, for the 2016 Unit 51 1st rifle elk hunt, ELK-1-170 (Figure 3):
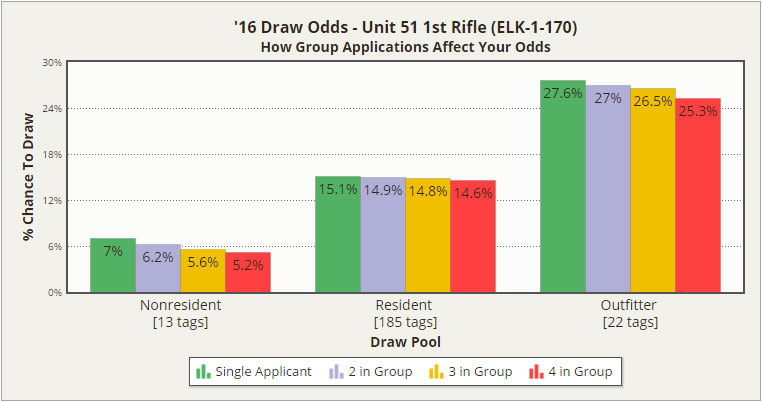
Notice that for residents, applying as a group does not make a significant difference in draw odds because of the high number of tags available to them in the draw. But if you are in the nonresident or outfitter pool, the group effect is something that can adversely affect your odds in a material way. Here’s another example of a hunt with a low tag quota, the 2016 Unit 16c 1st rifle elk hunt, ELK-1-251 (Figure 4):
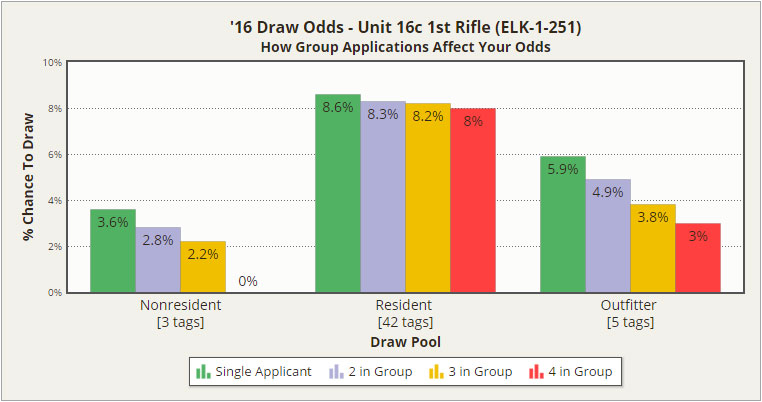
Again, we see that the nonresident and outfitter draws are impacted and this time the effect to residents is slightly more evident. It’s easy to look at the nonresident numbers and conclude that the difference between 3.6% and 2.2% is not significant. But keep in mind the reality. A 3.6% chance is roughly equivalent to reaching blindly into a bag of 26 ping pong balls and picking out the only green one. But if your chance is 2.2%, there are now roughly 44 ping pong balls in that bag. Although the odds are long no matter which bag you choose, I’m picking the bag with 26 if given a choice.
A group’s loss is an individual’s reward. With roughly 47% of all 2016 applicants in a group, those that apply solo have an advantage in the draw.
When your application is pulled in the draw, New Mexico evaluates your 1st, 2nd and 3rd hunt choices in order to see if a tag is still available before moving on to the next application. Given this fact, the optimum strategy is to put your hardest to draw hunt as your 1st choice, and the easiest to draw as your 3rd choice. This is fairly intuitive and widely known. Except when it isn’t.
In 2016, 48.1% of all elk, deer and antelope applications had incorrectly ordered their hunt choices such that they had a 0% chance of drawing either their 2nd or 3rd choice! This is a direct result of those applicants placing an easier to draw hunt in front of a harder to draw hunt.
The numbers from 2015 are very similar. Interestingly, residents are significantly more likely to order choices incorrectly. Here is a break down by species and residency status (Figure 5):
The impact of this on the overall draw odds is significant. Every instance of an incorrectly ordered hunt choice is represented on the NMG&F draw odds report(s) as if it were valid. Yet we know that in the real world, a large percentage of 2nd and 3rd choices have no chance of being successful. They are in effect throwing choices away and thus reducing the total number of valid applicants who have a real chance to draw that tag. Because of this, the true draw odds for a given hunt are better than what you've probably ever read (if you order your choices correctly).
Historically, the most common way to calculate draw odds in New Mexico was to take the total tags available and divide that number by the total applicant pool. More recently the results of other simulations have been published and marketed as the most accurate draw odds available. However, any simulation or model that doesn’t correctly account for group applications and actual hunt choice orders in the real world is missing key inputs.
We've update all of our New Mexico draw odds across the site based on the results of our work with the real applicant data. Our unit specific odds charts include 4 years of history that are calculated in the same manner.
The odds we show are 1st choice draw odds for a single applicant. If you order your 3 hunt choices from hardest to easiest, you can correctly assume that your application as a whole has the same draw odds as your easiest to draw choice. We will be releasing on online tool very soon where you can input 3 hunt choices, and we will give you back the order in which they should be in, as well as the 1st, 2nd and 3rd choice specific draw odds for each of those choices.
If you like this type of content, please subscribe to our email list to stay informed of our latest releases.