Nevada wasn't formally a part of our 2017 plan. But on short notice we decided to tackle Nevada to take full advantage of the time and effort that Toprut put into creating a draw simulation for New Mexico. Things moved pretty fast after that and in no time we were working through the process to obtain the information needed from the fine folks at the Nevada Department of Wildlife.
Nevada is similar to New Mexico in that all of your hunt choices are considered before they move on to the next application. And like New Mexico, Nevada does not issue any tags based on a true preference system so every tag is available to all applicants going into the draw. Nevada does however use a bonus point system where the number of "chances" you have in the draw are determined by squaring the number of bonus points you have going in and then adding one for the current application. So an application with 3 bonus points then has 10 chances in the drawing ([3*3]+1).
There are a couple of other differences worth pointing out as well. Nevada allows you to make up to 5 hunt choices per species category and group applications are only allowed for mule deer, antlerless elk and horns shorter than ears antelope.
Historically it's been difficult to get full applicant details from Nevada's big game draw. The state itself does provide reports detailing choice 1 applicants and success per bonus point level but detailed breakdowns of choice's 2-5 have generally been unavailable. And because evaluating all choices on every application is critical in seeing what your real chances are the Nevada draw odds have been a bit of a mystery.
Not surprisingly, a very significant number of applicants tend to use their 1-5 hunt choices in a manner that isn't optimal. Just like in New Mexico, if an easier to draw Choice 1 is ahead of a harder to draw Choice 2, you will effectively never draw Choice 2. This scenario is very common.
In 2016, greater than 44% of all resident antlered elk choices 2-5 were never drawn a single time over the course of many thousands of simulated draws. Nonresidents tended to do a slightly better job where only about 31% of 2-5 hunt choices were never drawn. These percentages are fairly consistent for all of the other big game species categories.
Our goal with the draw simulations that we perform is to emulate the actual draw run by the state as closely as possible. By doing so all the intricate complexities of the statistical math get factored into the summarized output of a draw process ran many 10's of thousands of times with the full applicant data. Our number one goal is, and will always be, to get it right.
We have had some questions about why our simulation results in both Nevada and New Mexico produce draw odds that are considerably better than what a paid alternative source has published. We are genuinely curious about that ourselves but in the end all we really know is how we get to our numbers. So with that in mind, we decided to take an exhaustive look at what our simulation produced and compare it broadly to the actual results from the 2016 draw. After all, if a simulation or model doesn't accurately reflect what really happens then what good is it?
It should be obvious that you can't compare the results from a single year's draw for any individual hunt/applicant to the output of 100,000 draws and expect to draw any meaningful conclusions. Rare events can and do happen all the time and every year people get lucky. So as an alternative we grouped all hunts at a given draw odds range, bonus point total, and species category together and then evaluated our draw odds to what actually happened in 2016.
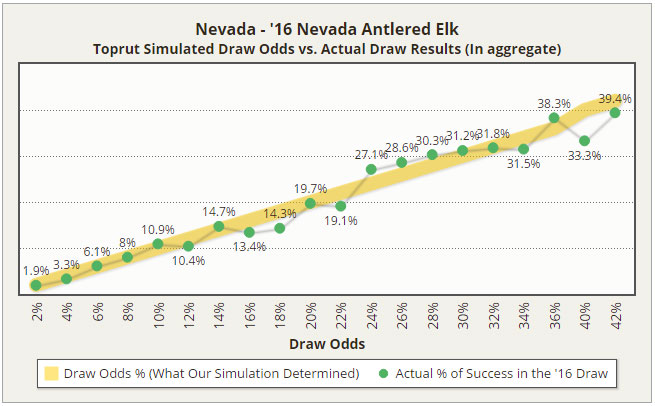
For example, in 2016 there where 475 applications (resident and nonresident combined) for antlered elk hunts where at a given bonus point level we showed the 1st choice draw odds being between 9 and 11%. So we then took a look at all of those 475 applications to see what percentage of first choice applicants actually drew a tag. In this particular case, 52 out of 475, or 10.9% were successful.
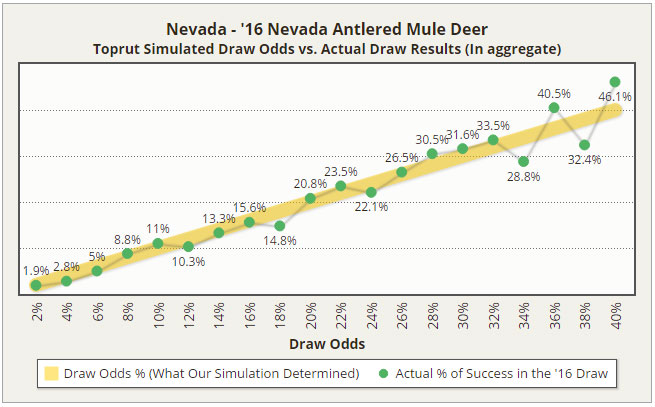
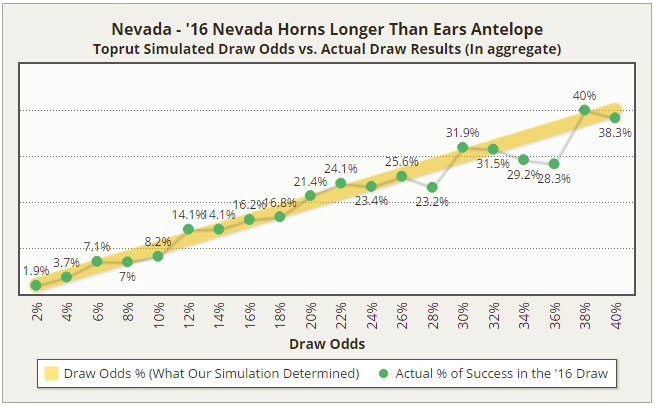
Our rationale is that such a comparison across many different odds ranges and species should in aggregate give a high level indication of how well our draw odds hold up against the actual results. If we consistently are seeing actual draw percentages fall well outside the range of draw odds we are evaluating then that would be indicative of a problem. Here's what we found for elk, antelope and mule deer:
Choice 1, 10% odds
Choice 2, 15% odds
Choice 3, 20% odds
Choice 4, 25% odds
Choice 5, 30% odds
The first thing to note is that your application as a whole has the same odds of being drawn as the highest draw odds hunt in your list - in this case 30%. This is true if you have them ordered the way we do above, or if you flip the order moving the current choice 5 up to choice 1.
So in the list of choices above, how do you figure out what your chances are at each point level?
Starting at the top, the choice 1 odds are always whatever they are listed at. So in this case 10%. From there, you do some simple subtraction to figure out the rest. Your choice 2 odds would be:
15% (choice 2 odds) - 10% (choice 1 odds) = 5% (odds you will actually draw your second choice)
Now you have a new 2nd choice draw odd of 5%, and you will use that value in your math as you progress down the list of choices.
You can use this same logic all the way down the list to choice 5. So, in order from top to bottom:
Choice 1 = 10%
Choice 2 = [original choice2 odds - choice1 odds, or 15 - 10] = 5%
Choice 3 = [original choice3 odds - (choice1 + new choice2 odds), or 20 - (10 + 5)] = 5%
Choice 4 = [original choice4 odds - (choice1 + new choice2 + new choice3 odds), or 25 - (10 + 5 + 5)] = 5%
Choice 5 = [original choice5 odds - (choice1 + new choice2 + new choice3 + new choice4 odds), or 30 - (10 + 5 + 5 + 5)] = 5%
So in the end, actuals:
Choice 1, 10% odds
Choice 2, 5% odds as a 2nd choice
Choice 3, 5% odds as a 3rd choice
Choice 4, 5% odds as a 4th choice
Choice 5, 5% odds as a 5th choice
Sum up the total, you get the 30% for the app as a whole.
So actual draw odds at a specific choice level are completely dependent on how you order your choices. Like has already been stated, do hardest to easiest and you'll have a chance at every hunt in your list with no negative effect on your overall chances on the application.
If you like this type of content, please subscribe to our email list to stay informed of our latest releases.